How much water does the United States of America consume on an annual basis? How has this changed over the last several decades? Which water source supplies the most water? Which sector demands the most water? The United States Geological Survey provides public data that helps us gain insight into consumption trends across the country.
Population vs Demand
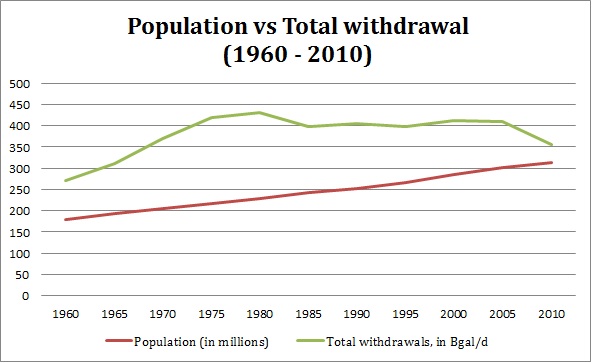
Population is in millions and Total Withdrawal is in Billion gallons per day (on Annual basis)
The United States’ population has seen a steady increase (~75%) from 1960 to 2010. Yet total water withdrawal has not followed the same trend. Water withdrawal was on the rise until 1980. It stabilized for the next 25 years, but saw a dip in 2010. Is this a good sign? Does it signify an increased adoption of water conservation measures by citizens for domestic use? Or was there adoption of water restrictive alternatives in different sectors?
Demand by Sector
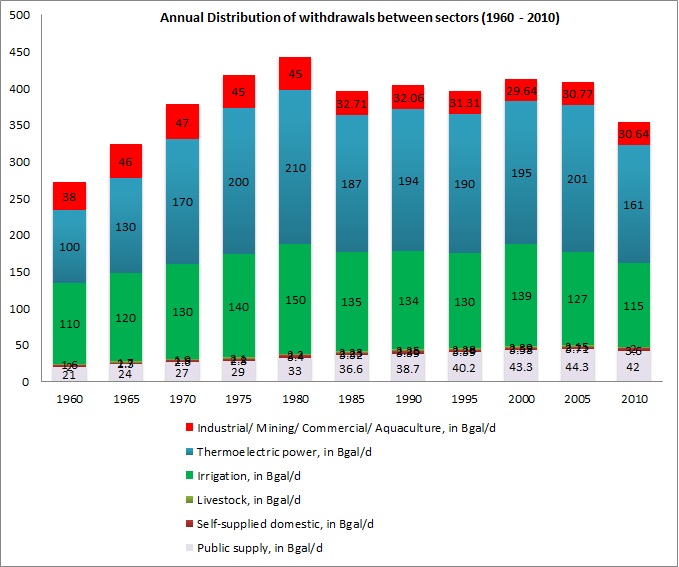
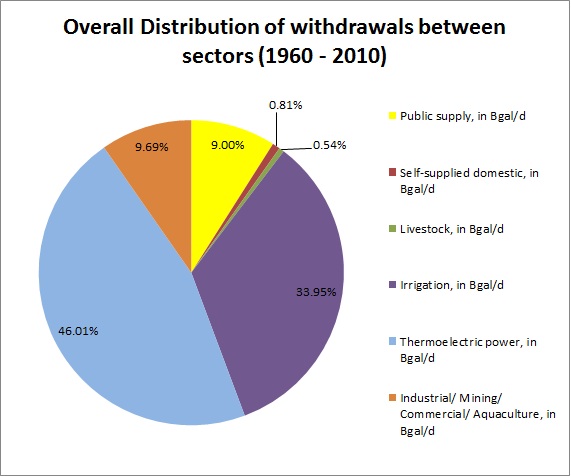
The two major water consumers are the thermoelectric power and irrigation sectors. They amount to almost 80% of the total demand. Both are on a gradual downward trend after their highs in 1980. Is water withdrawal for irrigation decreasing due to a drop in demand? Or is it because of better water management in irrigation?
Downward trends in water requirements for the thermoelectric power sector may be due to the shift towards using renewable energy sources.
Contrary to the behaviors shown by thermoelectric power and irrigation, the public supply sector – which takes care of domestic consumption- has steadily increased withdrawals. There has been a 100% withdrawal increase from 1960 to 2010. This has a positive correlation with the increasing population.
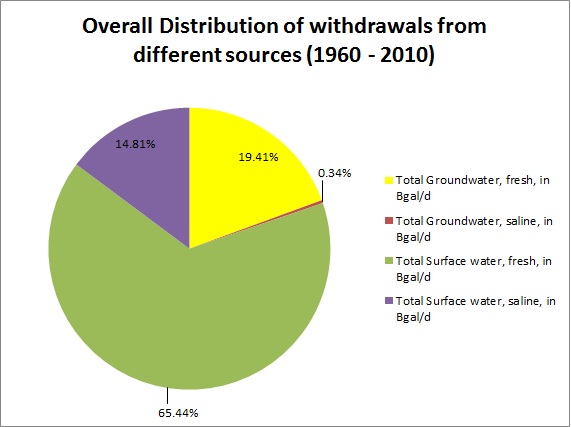
Source mix
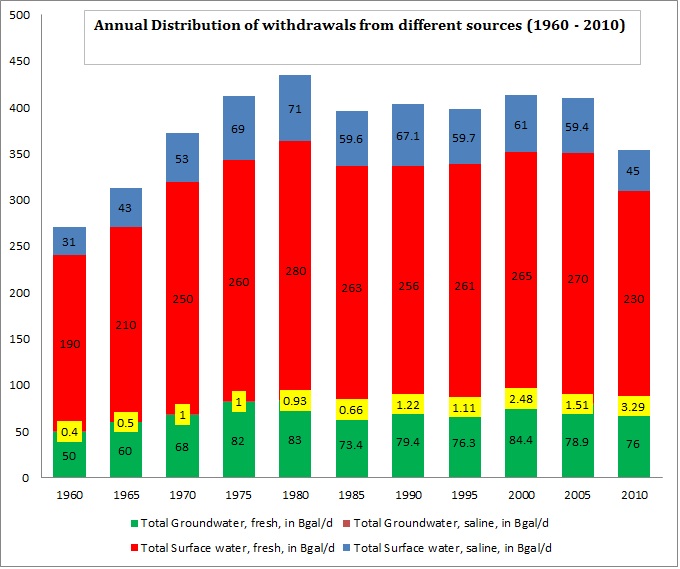
Surface water sources have proven to be the dominant withdrawal source.
Reference:
- http://waterdata.usgs.gov/nwis/wu