Detecting Climate Change
Since the 1980’s, the United States’ government has seen a need for accurate and unbiased historical climate records. To meet that need and help detect regional climate change, the National Oceanic and Atmospheric Administration developed a data set known as the United States Historical Climatology Network. This data consists of daily and monthly records of meteorological data from 1,218 weather stations spread over the 48 contiguous states of America.
Data provided daily includes the following observations:
- maximum temperature
- minimum temperature
- precipitation amount
- snowfall amount
- snow depth
Data provided monthly is on the:
- monthly-averaged maximum
- monthly-averaged minimum
- mean temperature
- total monthly precipitation
Some participating weather stations belong to the National Weather Service and are located in urban areas. The remaining weather stations are part of the US Cooperative Observing Network Stations, which are generally located in rural locations. For our purposes, the focus will remain on the precipitation data these stations have gathered.
Dissecting the Data
The precipitation data for the states of Tennessee and California is dissected in detail below. While 15 stations record data for Tennessee (TN), 54 stations do the job in California (CA). The graphs below show the patterns that emerge from the precipitation data recorded for these two states. For the sake of convenience, only the data for the period 1981-2015 has been considered for the analysis.
Tennessee
The average annual rainfall recorded across the 15 weather stations in Tennessee for the years of 1981 – 2015 is indicated below. There is not much variation in the average across the 15 stations, which indicates an equitable distribution.
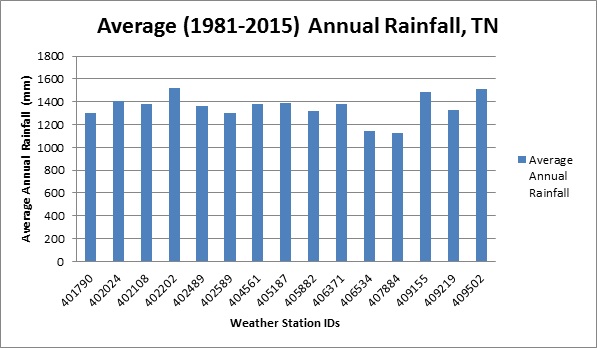
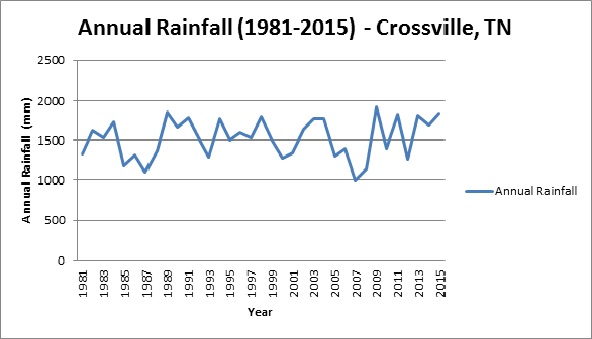
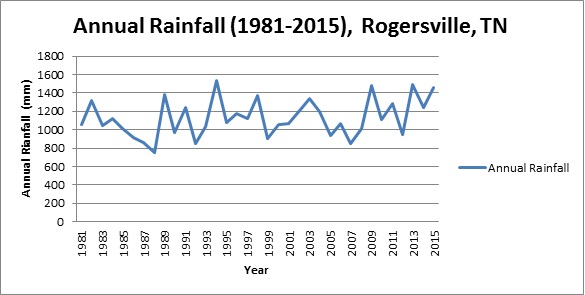
The weather station ID recording the highest average over the 35-year time period corresponds to Crossville (1,524 mm) while the lowest average (1,128 mm) is recorded in Rogersville, whose trends are indicated below.
California
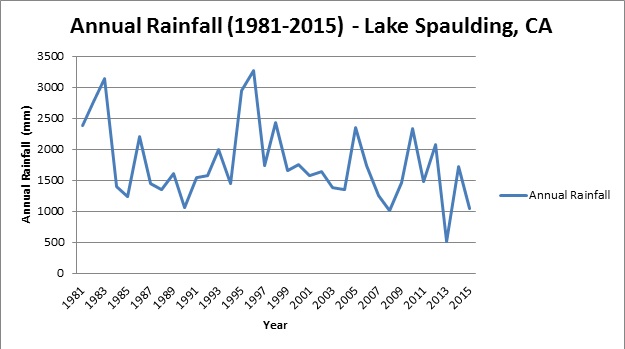
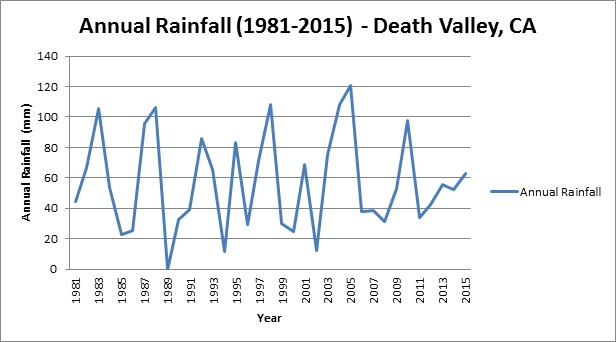
California experiences a more diverse spread in annual rainfall across its 54 weather stations. Lake Spaulding recorded the highest average (1,768 mm) while Death Valley recorded the lowest average (57 mm) for the 35-year time period. A significant difference of more than 1,700 mm between these two locations in California is observed.
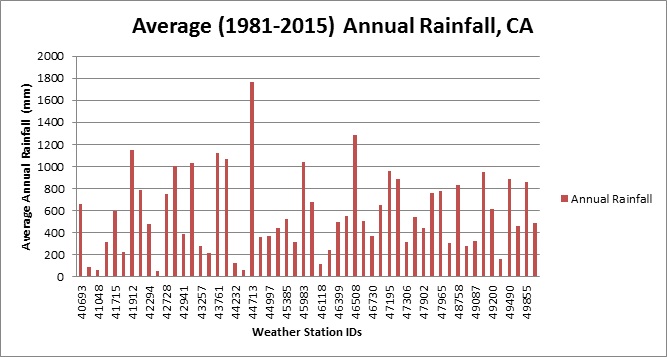
A time series analysis may reveal a possible trend of a decreasing annual rainfall in the case of Lake Spaulding, while Death Valley’s data displays a cyclical variation in its annual precipitation.
It should be interesting to see these trends for the remaining states as well to understand if there has been a decrease or increase in overall rainfall over the past few decades.
To discover how your state fared, click here.